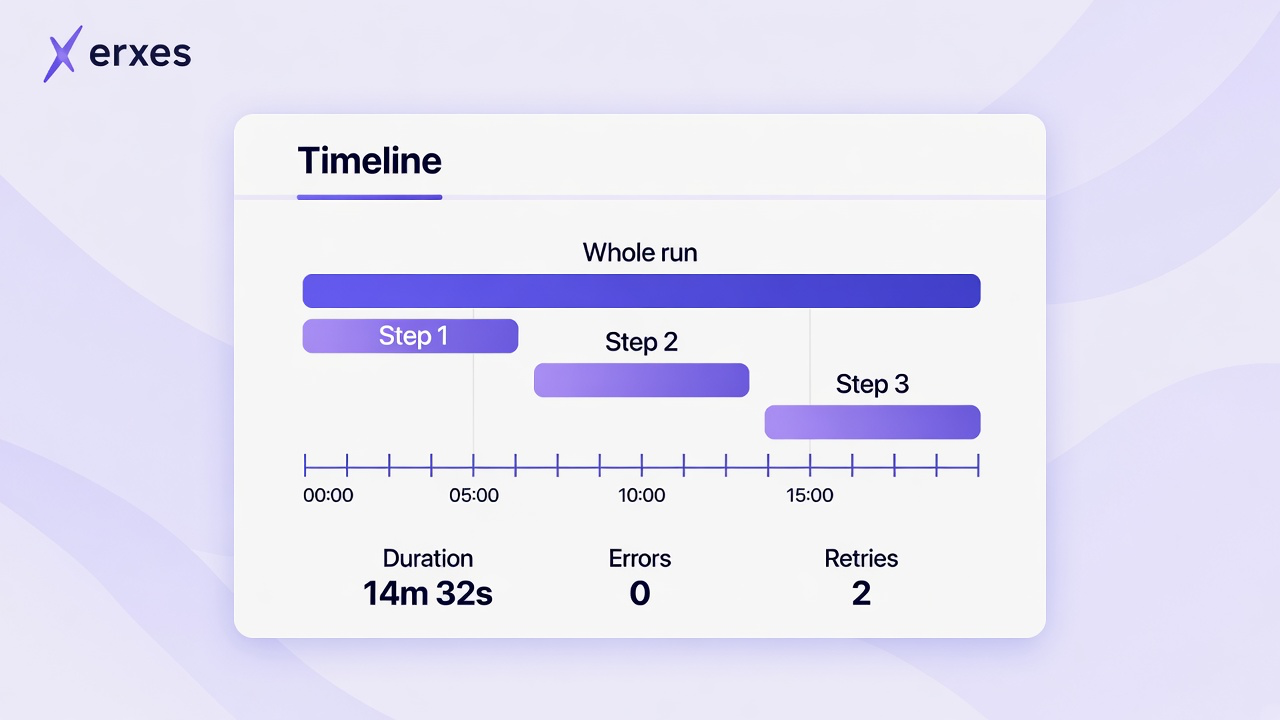
Automation run details now include a Timeline tab next to Flow and Table.
The timeline shows the whole run at the top, with each step below it on a time scale. Each step shows when it started, how long it took, and any time it waited in the queue. Steps that are still running are marked.
A summary above the timeline shows the run's total duration and its number of steps, errors, and retries. This makes it easier to see where a run slowed down or failed.